JetBrains Plugin
The PanDev Metrics plugin for JetBrains works across the entire family of IDEs (IntelliJ IDEA, PyCharm, WebStorm, Android Studio, GoLand, and more). It captures rich activity data—file edits, branch switches, session duration—and streams it to the PanDev Metrics Core.
Key Features
- Zero-click tracking – developers never need to start or stop the plugin manually.
- Granular telemetry – measure time per file, branch changes, opened projects, and other events.
- Privacy-first – no screenshots, screen recordings, or personal data collection.
- Seamless integration – everything arrives in PanDev Metrics Core for dashboards and reports.
Installation Steps
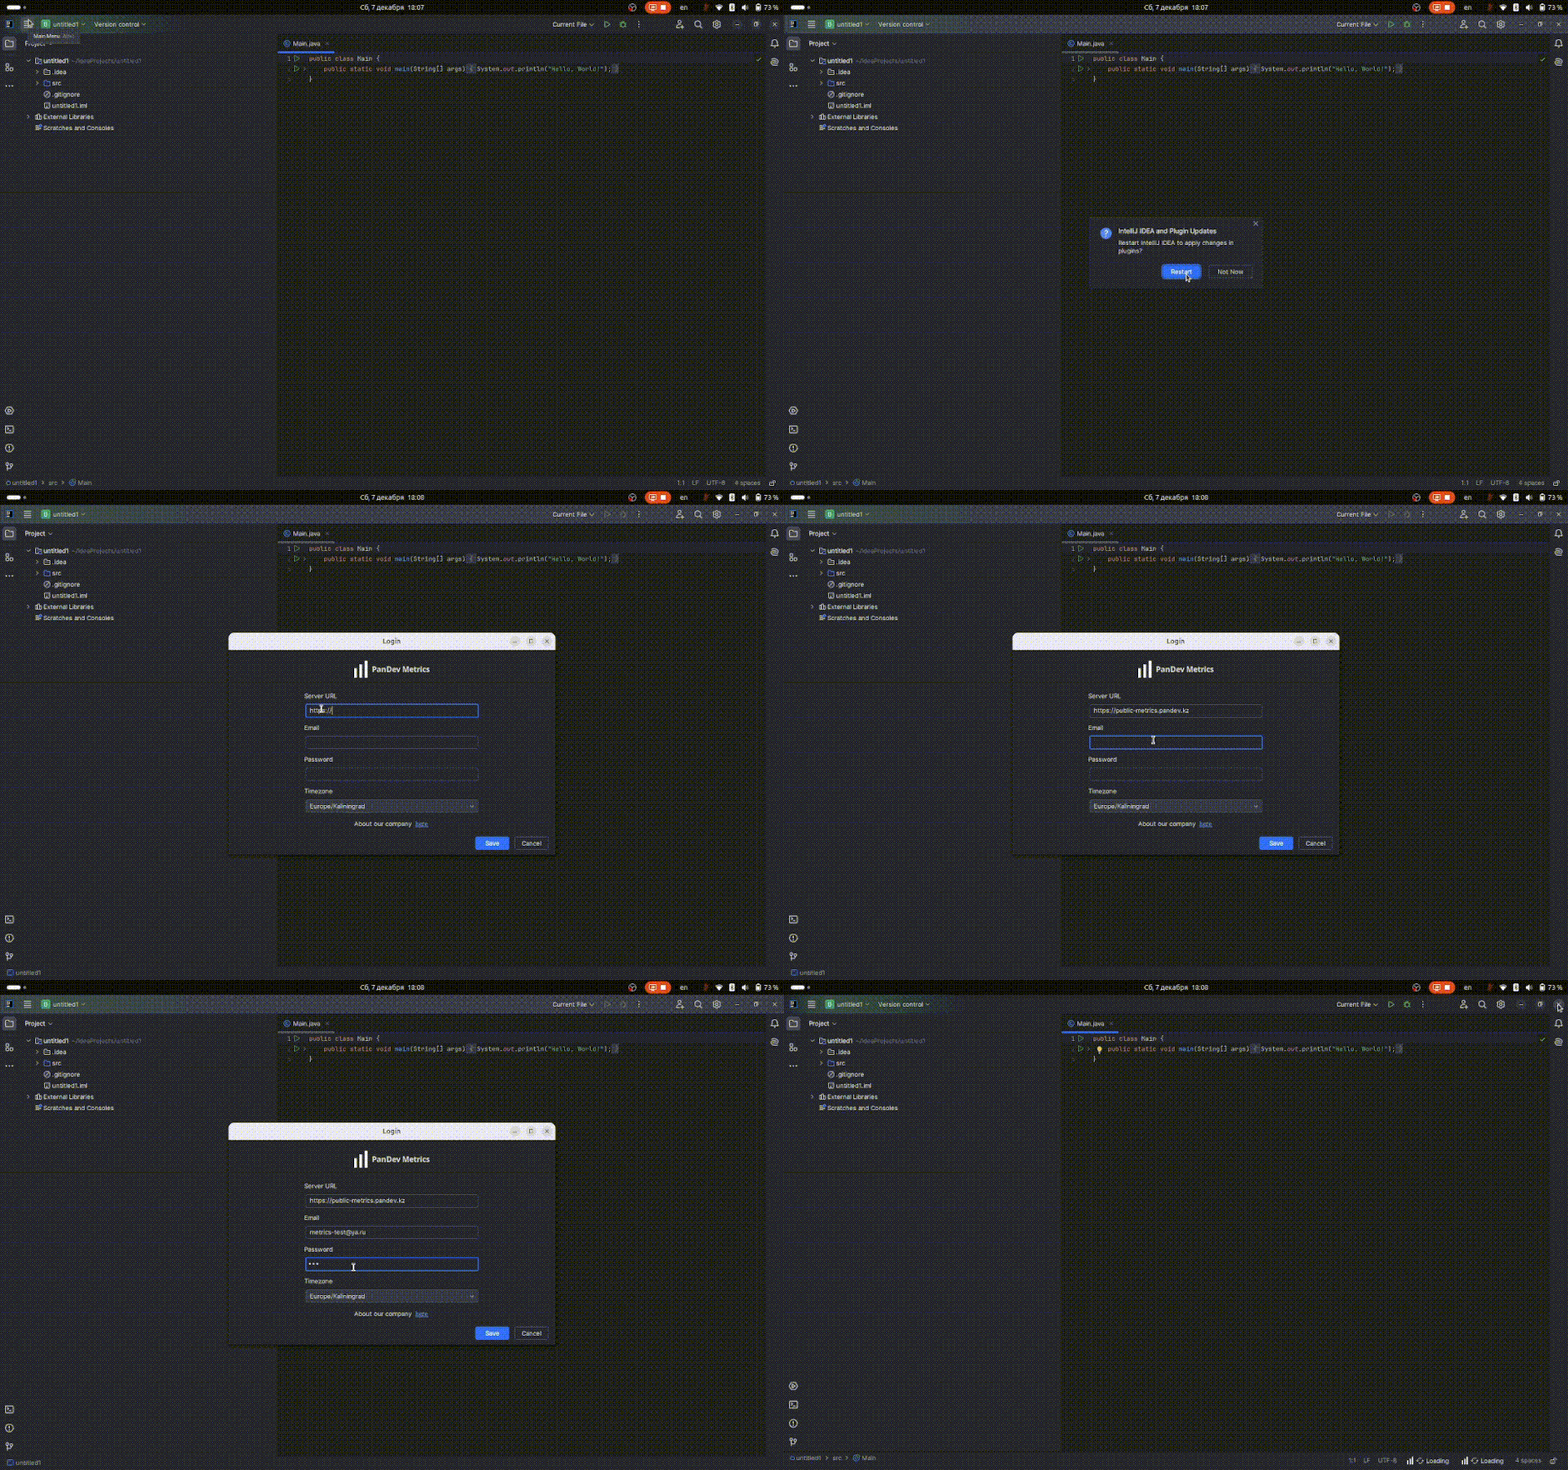
- Launch your JetBrains IDE (IntelliJ IDEA, PyCharm, etc.).
- Open Settings/Preferences → Plugins.
- Install the plugin from the packaged distribution—binaries are available in the release history.
- Restart the IDE to activate the plugin.

Configuration
- After restart, go to Settings → Tools → PanDev Metrics.
- Enter the Server URL (address of your PanDev Metrics Core).
- Provide the credentials shared by your administrator.
Everyday Usage
- The plugin runs silently in the background, tracking activity in open files and projects.
- Telemetry is sent to PanDev Metrics Core as work progresses.
- View the resulting metrics inside Grafana or any connected reporting tool.